Debugging Run
In the agent flow interface, you can click the debug button to start debugging the agent. Debugging helps identify issues with improperly configured nodes, inappropriate prompts, and other problems, ensuring the agent can fully execute the flow as designed.
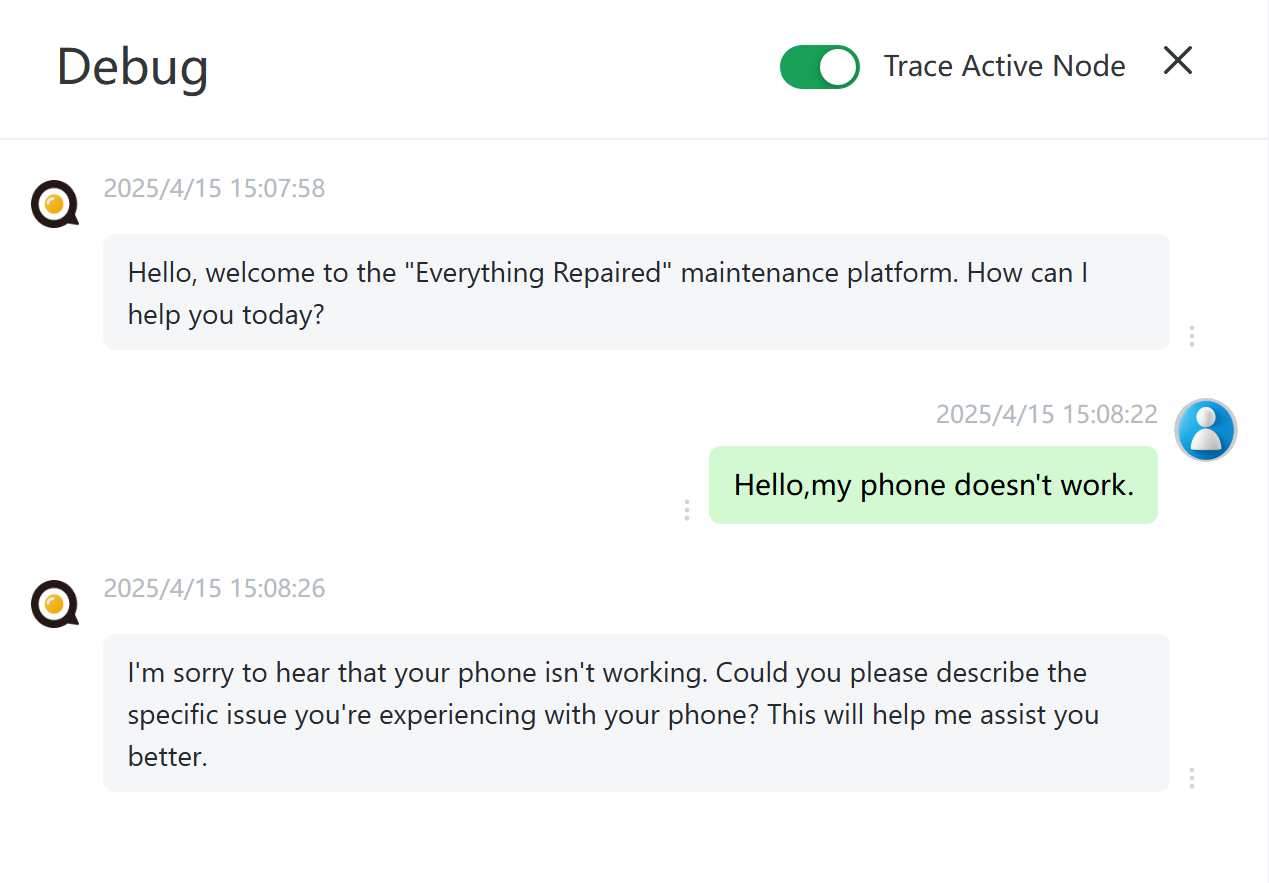
Track the Current Running Node
When this option is enabled, the current node will automatically be moved to the center of the flowchart canvas. The currently running node will have a rotating gear animation, and the nodes that have completed execution will display a checkmark icon.
Debugging Tips
Flexible use of Gendial’s agent nodes and flows can achieve various debugging goals.
Check the running result of a specific node: You can enable the Send result directly to the user switch for the node or save the node's output to a variable and view the specific runtime values from the History.
View variable values in real-time: You can use a Blank Node with the Send Original Text type. In the prompt, input {{variable_name}} to directly output the variable's value.
Debugging Code Nodes: The code node editor provides basic debugging capabilities. Click the Run button to directly execute the code.
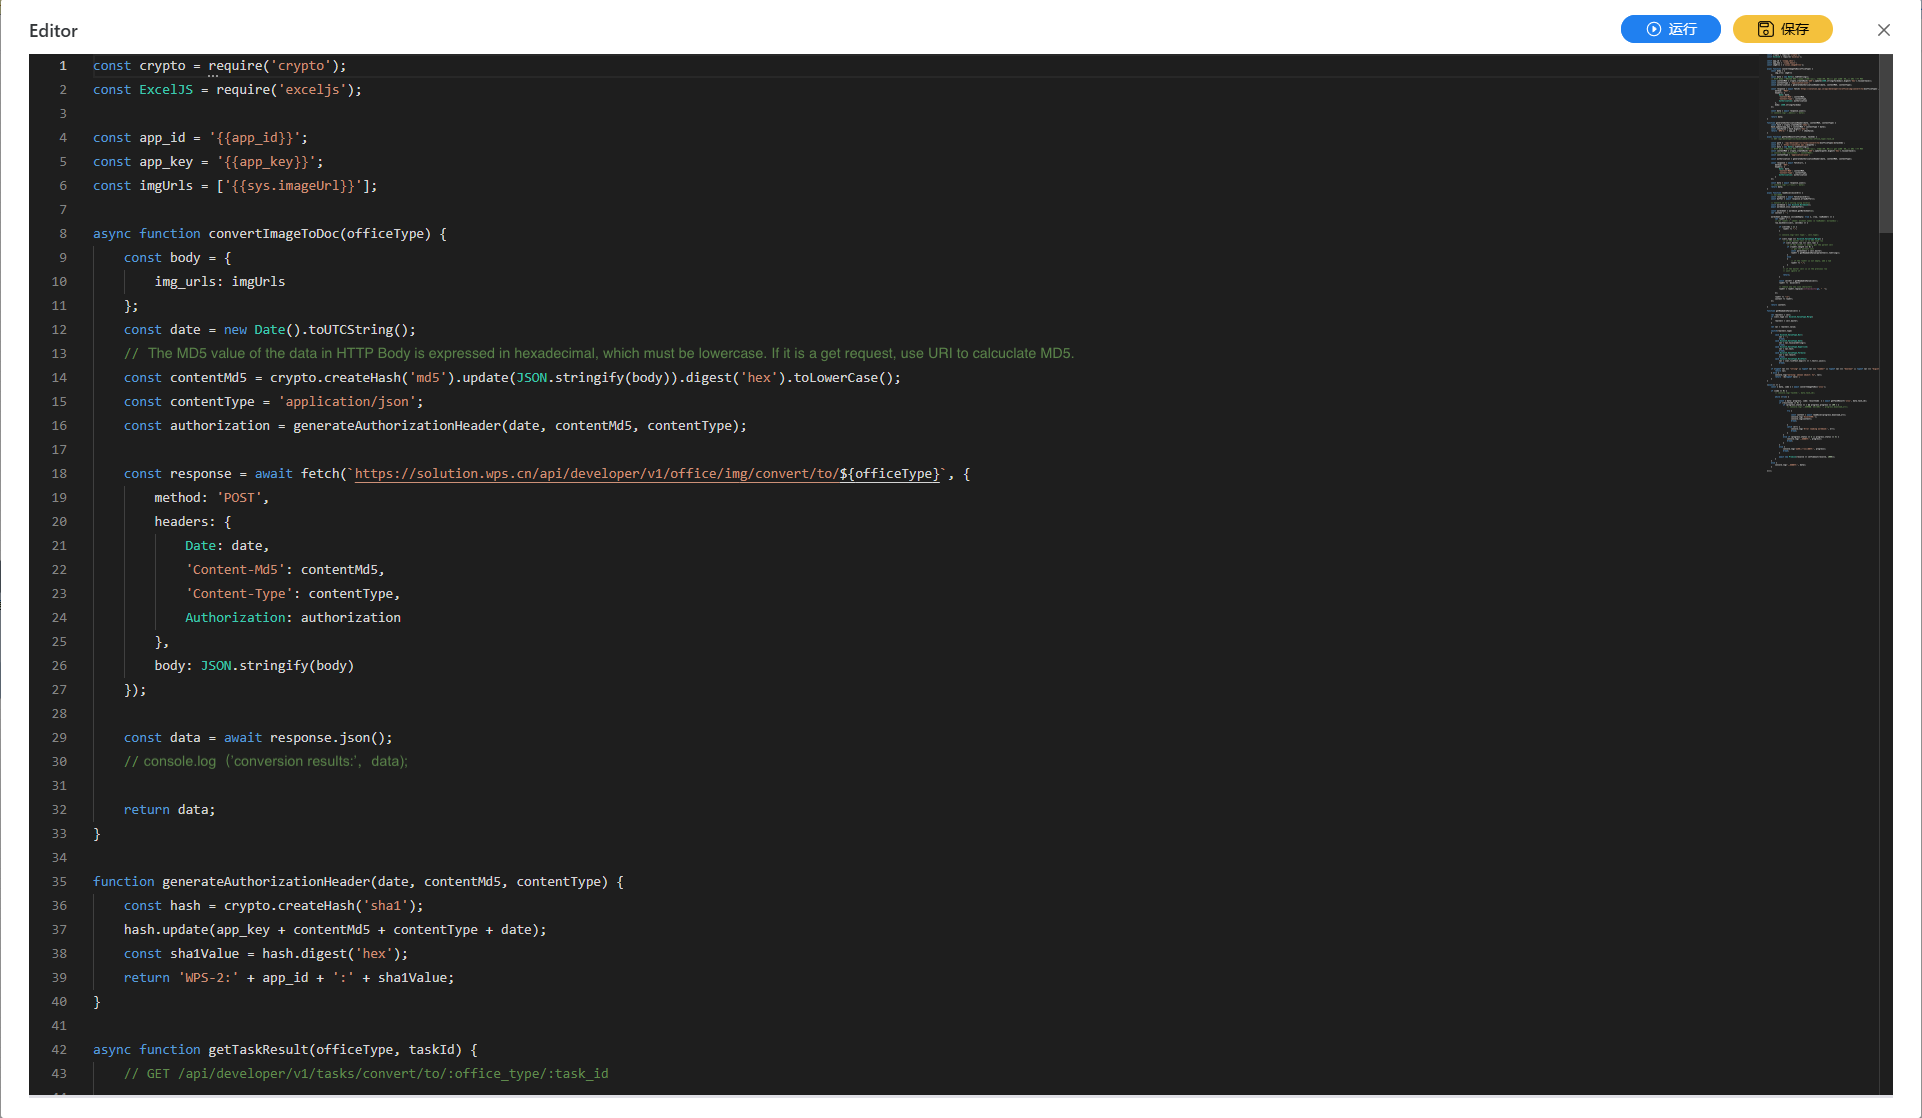
⚠️ Note: If the code references variables like {{variable_name}}, it will not run. You can temporarily hard-code the variable values in the code, and after the debug process passes, you can switch back to using {{variable_name}} to reference variables.